Sometimes people employed similar approximation as method III,
but ignoring the off-diagonal part as;
This approximation gives the same total cross sections as
those of a method III, however might give some deviation
in differential distributions.
Obtained results are listed in Table-1 and Figs.9-10. The total cross section shows a very good agreement with exact one. However some distributions show clear deviations from exact ones.
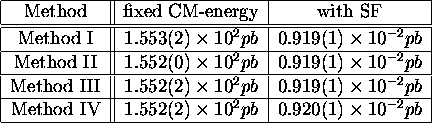
Table 1:
Total cross sections with fixed CM-energy
of 240GeV without the proton structure-function
and with HMRS(E) structure function.
Method II is multiplied by a branching ratio of 1/9.
Numbers in parentheses are statistical errors on a last digit.
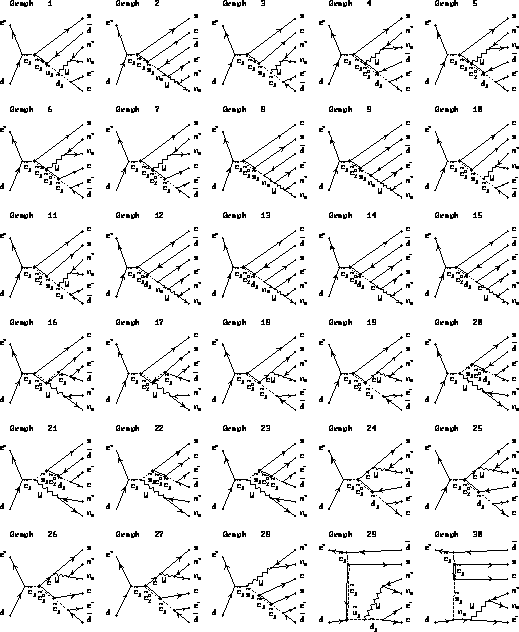
Figure 1:
Feynman diagrams of six body final state.
Restrictions of a model are described in the text.
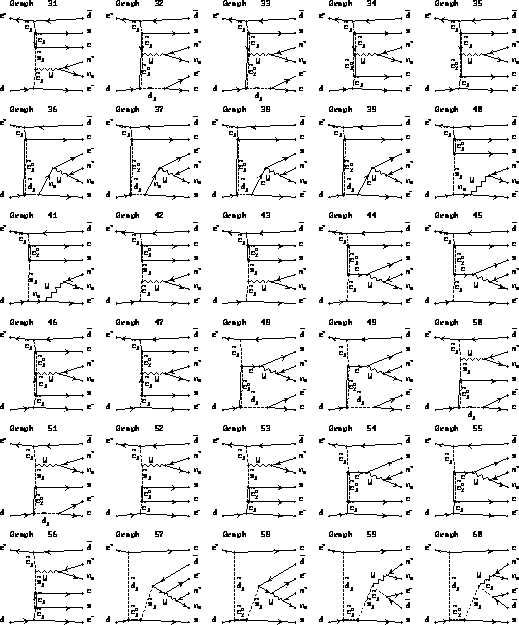
Figure 2:
Feynman diagrams of six body final state.
Restrictions of a model are described in the text. (cont'd)
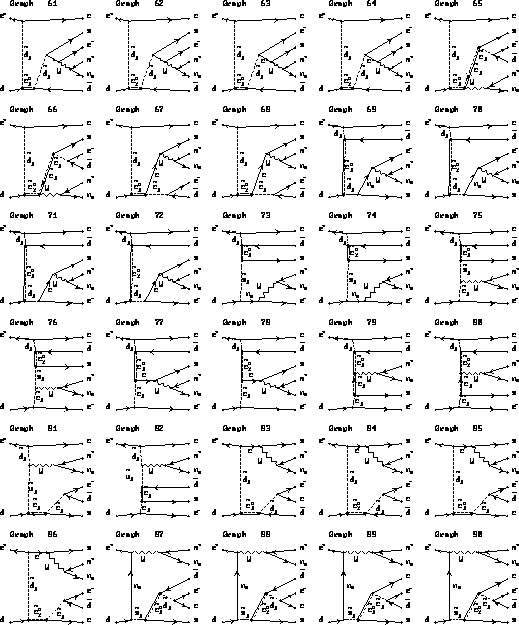
Figure 3:
Feynman diagrams of six body final state.
Restrictions of a model are described in the text. (cont'd)
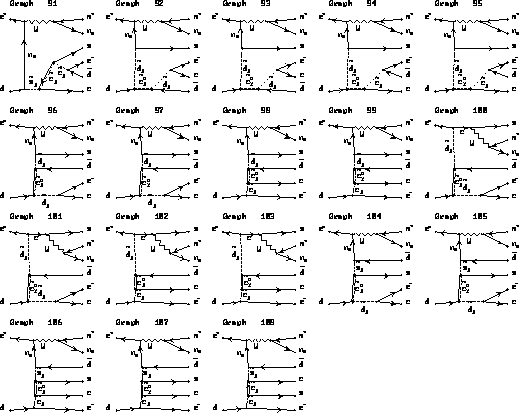
Figure 4:
Feynman diagrams of six body final state.
Restrictions of a model are described in the text. (cont'd)
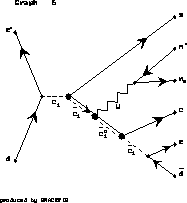
Figure 5:
Feynman diagram of a neutralino production via a scalar charm
in ![]() collision followed by its cascade decays.
collision followed by its cascade decays.
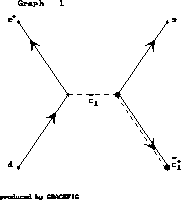
Figure 6:
Feynman diagram of a neutralino production via a scalar charm
in ![]() collision.
collision.
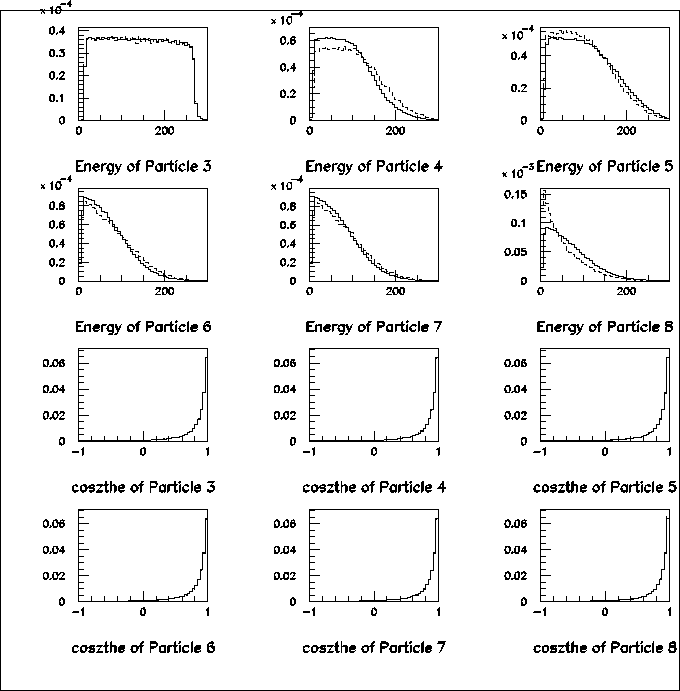
Figure 7:
Comparison between full amplitude and isotropic (cascade) decay.
Solid histograms come from full amplitude (method-I) and dashed from
isotropic decay (method-II).
Particle 3=s,
Particle 4=![]() ,
Particle 5=
,
Particle 5=![]() ,
Particle 6=
,
Particle 6=![]() ,
Particle 7=
,
Particle 7=![]() ,
Particle 8=c.
,
Particle 8=c.
Figure 8:
Comparison between full amplitude and isotropic (cascade) decay.
Solid histograms come from full amplitude (method-I) and dashed from
isotropic decay (method-II).
Particle 3=s,
Particle 4=![]() ,
Particle 5=
,
Particle 5=![]() ,
Particle 6=
,
Particle 6=![]() ,
Particle 7=
,
Particle 7=![]() ,
Particle 8=c.
Last figure is an angular distribution of muon
in W-boson rest frame
with respect to a direction of
a W momentum in a lab-frame.
,
Particle 8=c.
Last figure is an angular distribution of muon
in W-boson rest frame
with respect to a direction of
a W momentum in a lab-frame.
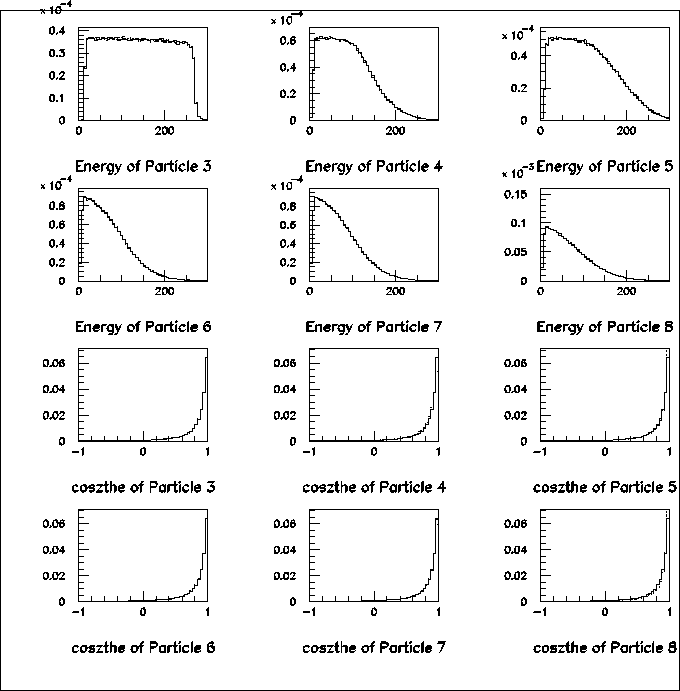
Figure 9:
Comparison between full amplitude and amplitude-based cascade decay.
Solid histograms come from full amplitude (method-I), dashed from
method-III and dotted from method-IV.
Particle 3=s,
Particle 4=![]() ,
Particle 5=
,
Particle 5=![]() ,
Particle 6=
,
Particle 6=![]() ,
Particle 7=
,
Particle 7=![]() ,
Particle 8=c.
,
Particle 8=c.
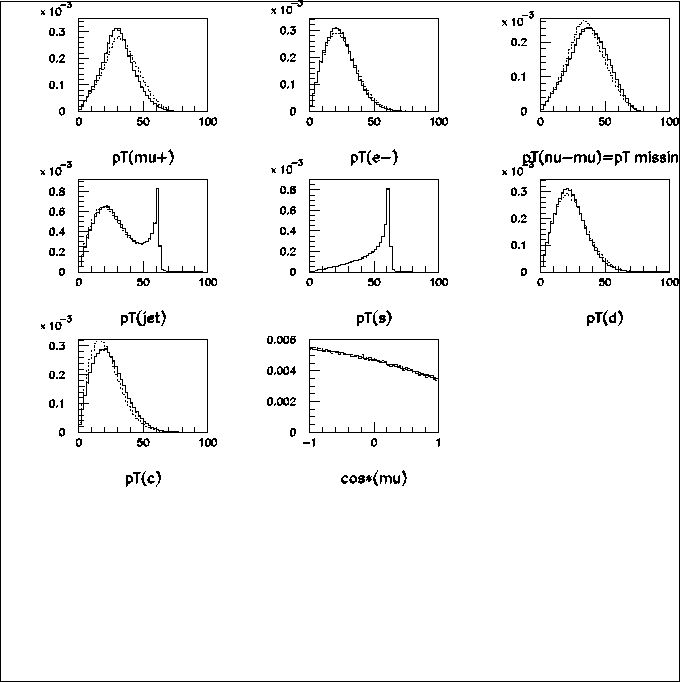
Figure 10:
Comparison between full amplitude and amplitude-based cascade decay.
Solid histograms come from full amplitude (method-I), dashed from
method-III and dotted from method-IV.
Particle 3=s,
Particle 4=![]() ,
Particle 5=
,
Particle 5=![]() ,
Particle 6=
,
Particle 6=![]() ,
Particle 7=
,
Particle 7=![]() ,
Particle 8=c.
Last figure is an angular distribution of muon
in W-boson rest frame
with respect to a direction of
a W momentum in a lab-frame.
,
Particle 8=c.
Last figure is an angular distribution of muon
in W-boson rest frame
with respect to a direction of
a W momentum in a lab-frame.